4 Insights You Need To Know About Video Length On Social Media

In theory, the answer to how long your brand’s video content should be on social media should always be the shorter, the better. For example, a 2015 Microsoft study found the average adult attention span is only 8 seconds, while TikTok has exploded in popularity, with 1 billion active global users, in large part because they placed tight limitations on how long videos can be. 

However, digging into the data, it’s clear that optimal video length is far more situational than just making the blanket statement that less is more. Not every piece of video is just an “average” level of interest to the audience, and not all ideas can be best communicated in just 8 seconds. Here are the top 4 insights marketers need to know about video length on social media. 

Insight #1: Optimal Video Length Varies By Social Platform 

Each social media platform has its own culture, and it would be a mistake to assume that the right video length for brand content would be the same across multiple audiences. For instance, looking at the 10 best performing video posts for episodic TV shows between January – August 2021; their average video length was 47 seconds long on TikTok,  1:20 minutes on Twitter, 4:17 minutes on Facebook,  and 4:11 minutes on YouTube. 

Nickelodeon’s top performing video so far in 2021 has been a 16 second clip, where Charli D’Amelio got slimed. That video got nearly 9.4 million responses on TikTok.  When that footage was shared on YouTube, it  included more build up to the slimming and was expanded to 1:05 minutes, receiving an additional 22,545 responses. Since the audience goes on YouTube expecting longer videos compared to TikTok, the additional time made sense.  

Insight  #2: Video Length Is Vertical Specific 

@benandjerrys

Get in there any way you can.

♬ original sound – benandjerrys

While the average length of top performing TikTok videos was 47 seconds for TV shows, between January – August 2021 the average length for the 10 best performing video posts for CPG Food on TikTok was 13 seconds long. The best performing CPG Food TikTok video was a Ben and Jerry’s clip about trying to scoop into frozen solid ice cream. The video clocked in at 9 seconds. 

In the same time period, the top 10 CPG Food posts averaged 1:42 minutes on YouTube,  0:34 seconds on Facebook, and 0:29 seconds on Twitter. 

That data just highlights how critical it is to benchmark your performance against brands in your own vertical to determine the most effective video length for your brand content. The audience’s attention span for a trailer of the latest Marvel movie and a video about heartburn medication is not going to be the same, and an apples to apples comparison is needed for length optimization. 

Insight #3. Let Influencers Dictate Video Length In Partnership Posts 

When working on paid partnerships, it’s important video length be at least in the ballpark of what the content creator normally posts on social, both because that’s what the influencer is most experienced at producing and because that’s what their audience expects of them.    

@sephora

From #SephoraSquad member @christineleeee: Easy claw-clip hairstyles! Which one is your fave? #SephoraSquad

♬ original sound – sephora

For instance, almost all the TikToks videos by beauty influencer Christine Le are between 6-32 seconds. The most popular Sephora TikTok between January – August 2021 was 22 seconds long and had 4.5 million views, featuring Christine Le showing off claw-clip hairstyles. Additionally, a Christine Le TikTok sponsored by Sephora showing off all night setting spray which was 14 seconds long, received 14.8 million views. These partnerships posts worked in large part because they were in the exact same format of Christine Le non-sponsored posts.   

Meanwhile, the comedy troop Dude Perfect tends to make videos that are slightly longer. For example, their best performing Instagram post so far this year generating 402,512 responses was about a baseball-basketball hybrid stunt and was 2:11 minutes long. Therefore, it makes sense that Dude Perfect’s sponsored content would be longer as well. Their top performing sponsored content video on Instagram with 103,685 responses was a 48 seconds long promotion for Nerf Curve Blasters, with their sponsored content posts being as long as 1:14 minutes.     

Insight #4. Certain Types Of Content Require Longer Video Length 

While generally the trend is shorter videos equal higher engagement, situationally there’s still types of content that are more effective at a longer length, such as makeup tutorials, unboxing videos, or other “how to” content. For example, the top performing YouTube video by Fenty Beauty between August  22, 2020 – August 21, 2021 with 748,030 views was a Tutorial Tuesday featuring Rihanna putting on powder foundation that clocked in at a little over two minutes. 

@fallontonight

FallonFlashback: @vindiesel shows off the various languages he had to learn when voicing Groot #FallonTonight #VinDiesel

♬ original sound – FallonTonight

Also videos from the entertainment industry such as film trailers or talk show clips often perform better when they’re longer. For example, so far in 2021, The Tonight Show Starring Jimmy Fallon post that generated the most responses on TikTok was Vin Diesel talking as Groot in different languages which was 1:23 minutes long. Meanwhile, the top performing film content on Facebook between January – September 2021 was the second F9 trailer which got 1,910,366 responses and was 3:20 minutes long.  

That’s not to suggest that in all instances, film videos should be over a minute long. Just look at the top 5 TikToks from films so far in 2021. They were all from F9 and between 6-22 seconds long. It’s important to analyze owned and competitor social media posts at scale to understand the exact circumstances where shorter is better.

For example, consider a call to action like “Tell us you’re a Fast & Furious fan without telling us you’re a Fast & Furious fan”. That can be communicated in 6 seconds, while an actual trailer requires more time to communicate the movie’s actual story. 

Looking for more insights on how to properly analyze video length on social media? Request a ListenFirst demo today!     

What Social Networks Were The Most Talked About In 2020

Whether it was a complete game changer or accelerating trends that were already in motion; the pandemic dramatically impacted what social media platforms we were using and discussing during the past year. To help quantify which social media platforms fell in and out of favor during 2020; we used our social listening abilities on Twitter to identify the following 5 insights your brand needs to know about the most widely used social media platforms.  

Methodology: Minus owned Tweets, looking at the number of times a social media platform was mentioned on Twitter between 2018 – 2020. 

Insight #1. Discussion about Facebook Decreased Dramatically 

There were 261,423,808 Tweets that mentioned Facebook in 2020; a decrease of -66% from 2019. It does not appear this trend is being driven by the pandemic, as starting in Q1 2019; the conversation around Facebook has decreased from the previous quarter 6 out of 7 times.  

Snapchat and LinkedIn were the other social networks that were discussed less in the past year. There were 19,512,228 Tweets mentioning Snapchat in 2020, down -7% from 2019. Meanwhile, there were 16,447,966 Tweets mentioning LinkedIn in 2020 which was a -6% decrease from 2019. In both cases, Snapchat and LinkedIn were less discussed for the second consecutive year. 

Insight #2. The Conversation Around TikTok Is Way Up, Particularly By Gen X 

There were 129,168,704 Tweets mentioning TikTok in 2020, which was a 360% increase from 2019. While President Trump’s attempts to ban TikTok in the United States certainly impacted the volume of conversation around the video app, it wasn’t the primary driver of that trend. There were 3,689,862 Tweets mentioning TikTok and either “Trump” or “Ban” in 2020; meaning the topic only accounted for about 4% of the increase in discussion about TIkTok. 

With 2020 being the year that TikTok became more mainstream, the demographics of people aware of the app has changed as well. In 2018, the audience for people Tweeting about TikTok was 74% Millennials and 12% Generation X.  By 2020, that had shifted to the audience for people Tweeting about TikTok being 57% Millennials and 29% Generation X. TikTok is now something on the radar of people born between 1965 and 1980; much more than was the case even 2 years ago.

Insight #3. Interest In Video And Messaging Exploded In 2020 

Especially with people stuck at home during the pandemic starving for entertainment; there was a significant uptick in the  real-time conversation around social media networks that are video focused in the past past year. For example, there were 1,330,442,552 Tweets that mentioned YouTube in 2020; a 48% increase from that number in 2019.  Similarly, there were 117,303,382 Tweets mentioning Twitch in 2020, an 86% increase from the volume of Twitch related Tweets in 2019.

There was also an increase in Tweets about social media networks that are messaging based. For instance, 72,317,756 Tweets mentioned WhatsApp in 2020; which was a 31% increase from 2019. Meanwhile Discord, which is a VoIP, instant messaging and digital distribution platform was discussed in 26,481,473 Tweets, which is up 135% from the volume of Tweets mentioning them in 2019.

Insight #4. The Conversation About Instagram Was Flat

Despite 2020 generally involving much less hanging out with other people, meaning fewer traditional opportunities to take traditional Instagram photos, there were 528,481,055 Tweets mentioning Instagram in 2020 which is statistically a 0% change from 2019. Tumblr was the other social media platform where the real-time conversation about them was essentially flat during the pandemic. It was mentioned in 23,179,798 Tweets in 2020, just a -1% decrease from 2019.   

Insight #5. The Twitter Audience For Pinterest, Twitch, and Discord Skews The Most Towards Gen Z 

Since not all age groups use Twitter equally, there are some considerable limitations in trying to determine the generational makeup of other social networks using their audience data. That stipulated, directionally there are some conclusions that can be established by looking at the audience of people posting about specific social networks. For instance, looking at Q4 2020, the audience of people Tweeting about LinkedIn was only 3% in the Generation Z age group. No audience around the Twitter mentions of any other social media platforms we checked in Q4 2020 has a lower percentage of Generation Z followers. 

On the other hand, the audience of people Tweeting about Pinterest, Twitch, and Discord was 7% from Generation Z during Q4 2020 ; the highest such total during that time period. That doesn’t mean that the audience for Pinterest, Twitch, and Discord is only 7% Generation Z; it’s presumably quite higher. However for brands that are looking to reach Generation Z through social media platforms, it is an indication that Pinterest, Twitch, and Discord merit further investigation while LinkedIn would likely be a dead end. 

Want more social listening based insights on how your brand should approach social media? Request a ListenFirst demo now! 

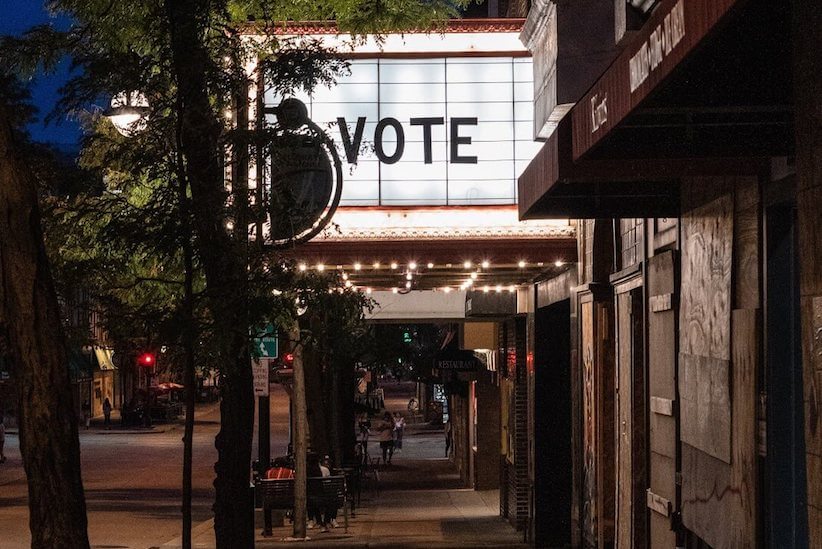
Social Insights Around The Final Presidential Debate

With Donald Trump and Joe Biden having just wrapped up their second and final debate together, ListenFirst decided to take a closer look and see what social analytics could tell us about the two candidates’ performances, the topics that stood out, and what the social media audience is talking about most.  

First Impressions Mattered More Around The Presidential Debates 

There were 787,741 Tweets using the official #Debates2020 hashtag on October 22, 2020 in the United States. In comparison, there were 1,316,265 Tweets using the #Debates2020 hashtag on September 29, 2020; around the first presidential debate.

Sentiment Around Trump Was Less Negative Compared To The Previous Debate 

There were 3,199,419 Tweets in the United States that mentioned Donald Trump on October 22, 2020 around the second debate which -43% less Tweets than the 5,626,707 that mentioned him on September 29, 2020, the day of the first debate. Still, Twitter sentiment around Donald Trump was 44% Negative and 14% Positive the day of the first debate, with that improving to 40% Negative and 18% Positive the day of the second debate. He generated less Tweets the second time around, because the Twitter audience viewed his performance as more steady. 

Joe Biden has less variance on Twitter around the two debates. On September 29, 2020, there were 3,507,702 Tweets mentioning him, with sentiment around those Tweets being 44% Negative and 11% Positive. On October 22, 2020; Biden was mentioned in 3,126,047 Tweets with sentiment for those Tweets being 42% Negative and 12% Positive.

It appears the more civil second debate benefited both candidates; there was less negative conversation around Trump, while Biden was mentioned in a greater share of the online conversation compared to the first debate.

Trump Still Picking Up More New Followers on Debate Night 

On the day of both debates, Trump outperformed Biden by every owned social metric. Joe Biden generated 112,211 new fans or followers on social media and 3,609,228 responses to the content he posted on September 29, 2020 with Biden receiving 94,228 new fans or followers and 3,714,619 responses to the content he posted on October 22, 2020.   

In contrast, on September 29, 2020, Donald Trump generated 135,541 new fans or followers on social media and 10,928,044 responses to the content he posted. Meanwhile on October 22, 2020; he generated 115,227 new social media fans or followers with the content he posted receiving 11,864,718 responses on the day. 

On Twitter, Biden Was More Linked To Hunter Than Trump Was To The Coronavirus

During the second debate, Joe Biden’s biggest line of attack was trying to blame Trump for the coronavirus response while Donald Trump attempted to steer the conversation to Biden’s son Hunter. It appears that Donald Trump was more successful at influencing the social media conversation. There were 290,061 Tweets in the United States that mentioned both Joe and Hunter Biden on October 22, 2020, with sentiment around those Tweets being 41% Negative and 8% Positive. Overall, there were 751,872 global Tweets mentioning both Joe and Hunter Biden on October 22, meaning 61% of the Tweets talking about the two were coming from outside of the United States.  

Meanwhile, there were only 141,439 Tweets that mentioned both Donald Trump and the Coronavirus on October 22, 2020 in the United States, with sentiment around those Tweets being 45% Negative and 12% Positive. 

There Was A Negative Response On Social To Biden’s Oil Policy 

Perhaps the biggest policy news to come out of the second presidential debate was that Joe Biden wanted in the long term to transition away from the oil industry. It was not well received on Twitter. In the United States on October 22, 2020 there were 145,430 Tweets mentioning Joe Biden and either Oil or Fracking, with Twitter sentiment around those Tweets being 42% Negative and 6% Positive. 23% of the Tweets expressed the emotion of Anger specifically. 

Twitter Panned Both Presidential Debate Moderators 

Being the moderator of a presidential debate remains a rather thankless role. On television Kristen Welker received great reviews for her moderation of the second debate, for instance Chris Wallace admitted he was jealous that Welker got to moderate a debate where there weren’t hundreds of interruptions. However on Twitter, sentiment around both moderators was overwhelmingly negative. 

There were 932,190 Tweets that mentioned Chris Wallace in the United States on September 29, 2020 with Twitter sentiment around him being 51% Negative and 13% Positive. Meanwhile there were 126,402 Tweets that mentioned the moderator Kristen Welker in the United States on October 22, 2020; with sentiment around those Tweets being 46% Negative and 17% Positive.      

Want more social media insights about current events? Request a ListenFIrst demo today!

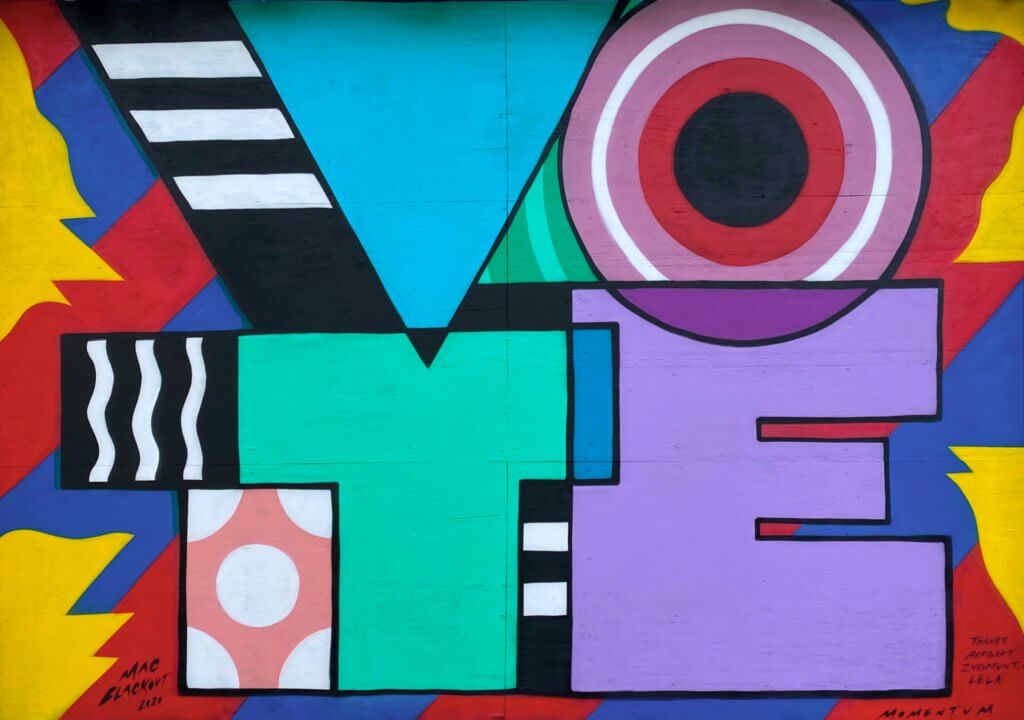
How The Swing States Are Feeling About The Election On Social Media

Every four years, the U.S. presidential election usually comes down to a few swing states that decide the winner. While social media can’t predict who the winner will be, analyzing consumer behavior on social media serves as a barometer for determining how people in those swing states are feeling. 

How are people feeling in Arizona, Colorado, Florida, Georgia, Iowa, Michigan, Minnesota, Nevada,  New Hampshire,  North Carolina, Ohio, Pennsylvania, Virginia, and Wisconsin? Here are the insights we found. 

Swing State Tweets Mentioning Voting, 3-4 Weeks Out From The Election  

Swing StateMentions of “Vote” 3-4 Weeks Out From the 2020 Election % Change Compared To 3-4 weeks Before the 2016 Election
Arizona342,914+527
Colorado241,048+562
Florida969,413+403
Georgia245,022+327
Iowa67,575+313
Michigan298,755+449
Minnesota185,646+560
Nevada159,395+365
New Hampshire45,041+461
North Carolina345,381+372
Ohio351,329+315
Pennsylvania422,071+389
Virginia296,232+365
Wisconsin136,859+388

Methodology: Looking at the volume of Tweets in Swing states using the word “Vote” or “Voting” 3-4 weeks out from election in 2020 compared to in 2016, meaning October 6-19, 2020 compared to October 5-18, 2016. 

Swing States Are Tweeting 402% More About Voting Than In 2016 

In the 3-4 weeks before the presidential election (Oct 6-19), Swing states are talking about voting 402% more than the same time period in 2016, and 111% more than during the 2018 midterm elections. With record early voting turnouts across the country, it’s no surprise more people are talking about getting out the vote.

Just Like In 2016, Swing States Are Talking More About Trump and Voting Than His Opponent 

3-4 weeks before the election in 2016, there were 563,180 Tweets in swing states talking about Donald Trump and Voting, compared to 132,337 Tweets talking about Hillary Clinton and Voting in those states. In 2020, with the added advantage of Donald Trump having the platform of the presidency to amplify his messaging, that gap against his Democratic opponent has only widened. This year, there were 2,477,512 Tweets talking about Voting and Trump compared to 543,809 Tweets talking about Voting and Joe Biden in Swing states in the 3-4 weeks before election day.

That’s not to say any Tweet talking about Donald Trump and Voting is inherently a positive for him, it often isn’t; but it’s more likely to be a Tweet supporting him than a comparable Tweet talking about Joe Biden. For instance in the critical swing state of Florida, sentiment in Tweets mentioning Trump and Voting between October 6 -19, 2020 were 41% Negative and 18% Positive. While that’s not exactly a ringing endorsement; during the same time period in Florida, Tweets mentioning Voting around Joe Biden were 47% Negative and only 11% Positive. 

There Are More Mentions in Swing States About Voting Blue Than Red 

Volume of Vote ‘Red’ Or ‘Blue’ Tweets In Swing States 

StateVote Red TweetsVote Blue Tweets
Arizona6,3795,837
Colorado2,9195,116
Florida18,07415,597
Georgia2,5093,291
Iowa7731,353
Michigan3,6214,564
Minnesota2,1643,122
Nevada3,6172,588
New Hampshire703738
North Carolina5,3745,255
Ohio4,8725,901
Pennsylvania5,7256,753
Virginia4,5474,727
Wisconsin1,5982,038

Methodology: Looking at the volume of Tweets in Swing states between October 6 -19, 2020 that mentioned both ‘Vote’ and either the word ‘Blue’ or ‘Red’.  

Between October 6 -19, 2020; there were 66,880 Tweets in Swing states about Voting Blue, which is 6% more Tweets than the 62,875 Tweets in Swing states talking about Voting Red. We’ve previously discussed how Donald Trump is far more successful than Joe Biden at growing his social media following, but that’s at a candidate level. This data suggests that Swing state voting could narrowly break for the Democrats and Joe Biden because of party affiliation, even if Swing state voters aren’t Joe Biden fans specifically.   

The Twitter Conversation Around Voter Fraud Is Growing 

Users in Swing states posted 294,375 Tweets about Voter Fraud between October 6-19, 2020, which was a 92% increase from the volume of Swing states Tweets about Voter Fraud 3-4 weeks out from the election in 2016, and a 79% increase from the amount of Swing state Tweets talking Voter Fraud 3-4 weeks before the 2018 Midterm elections. However, the elections break in Swing states on November 3, there’s a heightened level of concern that the other side isn’t going to accept the results.

Swing States Are Talking More About Early Voting 


The New York Times reports that in 5 states, including the swing states of Wisconsin and Minnesota, the number of ballots returned is already more than 20% of the entire 2016 turnout; and the level of social media discussion definitely supports the idea that Early Voting is taking on an added importance during the pandemic. Three to four weeks before the 2020 election, there have been 196,854 Tweets in Swing States talking about Early Voting; up 121% from the volume of Tweets in those states discussing Early Voting 3-4 weeks before the 2018 midterms with that also being 1,113% more Tweets than discussed Early Voting 3-4 weeks before the 2016 elections.

Want more social media insights around the elections and other upcoming cultural events? Request a ListenFirst demo today!

What Type Of Social Media Posts Are Working For Presidential Candidates 

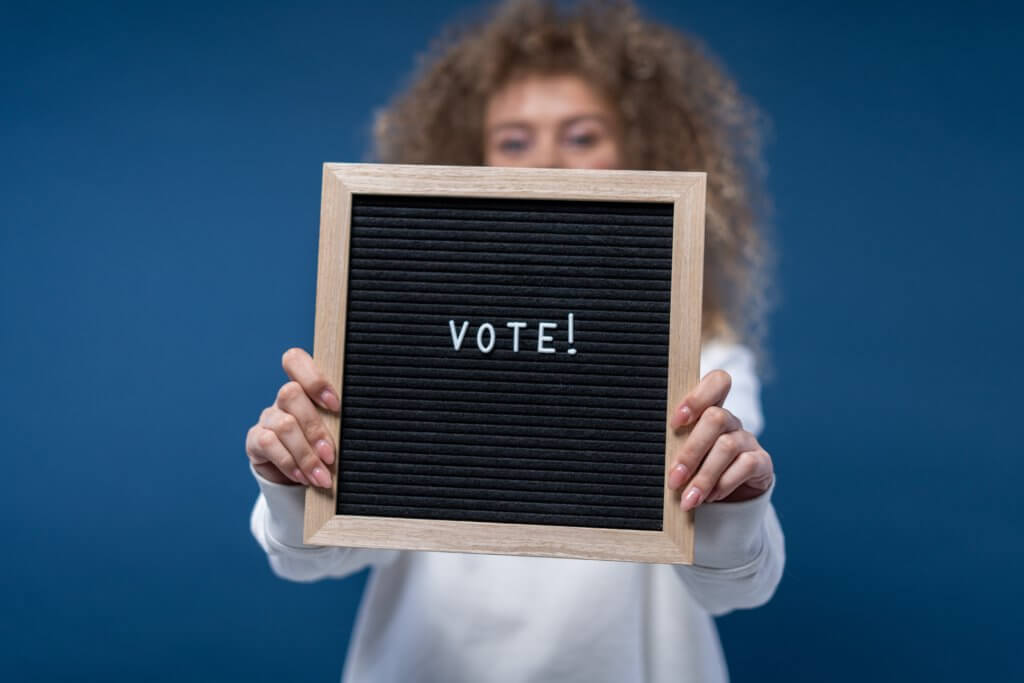
While the pandemic might have overshadowed what would have otherwise been wall-to-wall coverage of the presidential race, there’s still going to be an election in a few months, which means it’s time for ListenFirst to break out its analytics and share insights about what type of social media posts are most effective for each presidential candidates. With Kanye West now having entered the fray, here’s what social media strategy is working best for each of the presidential candidates since Kanye’s July 4th announcement.

Abortion Appears To Be The Campaign Issue Most Associated With Kanye West 

Between July 4 – August 11, 2020 there were 143,896 Tweets mentioning both Kanye and Abortion; though sentiment around those Tweets was 44% Negative, compared to 4% Positive. Kanye had talked at a campaign rally about how they had considered aborting his now 7-year-old daughter, and how upsetting that is to him. For every Tweet praising his Pro-Life stance, there were a lot more saying things like “kanye saying abortion isn’t natural whilst having two surrogate babies is hilarious to me.” 

While Kanye’s Pro-Life message is generating more negative than positive feedback, there’s still an audience that his feelings about abortion are connecting with, and as a third-party candidate; focusing on Pro-Life messaging might be his best chance on becoming a greater part of the national conversation.

President Trump Posts Short, All Caps Tweets Because They Generate The Most Responses 

https://twitter.com/realDonaldTrump/status/1284816646104928256

President Trump’s Tweets tend to perform the best in slogan form. For instance between July 4 – August 11, 2020; 4 of the top 10 best performing Tweets by Donald Trump said “MAKE AMERICA GREAT AGAIN!” and only that; with those Tweets averaging 645,662 responses. Overall, 9 of the 10 President Trump Tweets that generated the most responses in that time period were just one sentence long with “OPEN THE SCHOOLS!!!” generating 688,231 responses and only containing three words.   

During the same time period and in keeping with that less is more strategy, his top performing post on Instagram which generated 1,658,587 responses was a captionless picture of him posing with Goya products at the White House.  

‘Not Trump’ Tweets Are Performing The Best For Biden 

Generating 848,461 responses, the top performing Tweet for Joe Biden between July 4 – August 11 said “You won’t have to worry about my tweets when I’m president”. Other top performing posts included a Tweet that generated 404,892 responses saying we can’t let Donald Trump open up the Grand Canyon for uranium mining and a Tweet saying President Trump is ignoring the President Obama playbook for fighting pandemic which generated 404,702 responses. In comparison, the Tweet announcing Kamala Harris as his VP choice that didn’t mention Trump received 391,399 responses. It appears framing his Tweets as a critique of President Trump is his most effective strategy.

Conclusion:

Just like in any other type of social media marketing; connecting with the audience around political campaigns requires having social media analytics to understand what messaging is most resonant. ListenFirst provides the insights necessary for that winning social media strategy.

Want more social listening insights from ListenFirst about current events and the cultural conversations Request a demo today!

Learning From #StopHateForProfit July And If The Boycott Is Carrying Into August

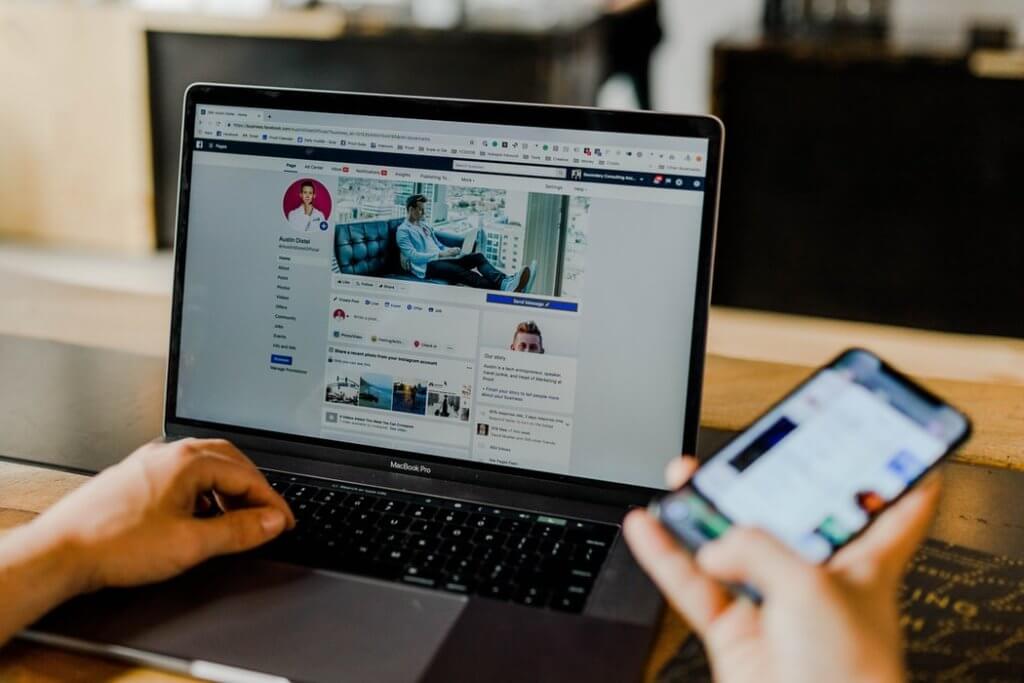
With more than 1,100 businesses ultimately signing up for the Anti-Defamation League’s  #StopHateForProfit Boycott of Facebook and Instagram ads in July 2020, the campaign succeeded at getting both the press and the public’s attention. However, what facts actually changed on the ground for brands around social media? Now that July has ended, we answer those questions as well as look at if the boycott is continuing on into August. 

Here are the 5 most interesting insights ListenFirst found. 

Insight #1. Brands Shared –67% Less New Facebook Ads In July 

Methodology: Looking at the indexed number of Facebook and Instagram ads brands from the ListenFirst Data Co-op launched between July 2020 compared to the indexed number of Facebook and Instagram ads brands launched between July 2019.

Data from the ListenFirst Data Co-op shows that the #StopHateForProfit boycott resulted in brands sharing -67% less new ads on Facebook and Instagram in July 2020 compared to July 2019. While there are reports of a few companies increasing their Facebook spend in July, on the whole the level of brand participation in the Stop Hate For Profit boycott was fairly dramatic. 

Insight #2. The Facebook Boycott Isn’t Ending Just Because July Did 

Early evidence indicates that brands are advertising less going into August. During August 1-2, 2020; ListenFirst Data Co-op brands shared -97% less new ads on Facebook and Instagram compared to August 1-2, 2019. Adjusting that for the fact that August began on the weekend, brands shared -73% less new Facebook and Instagram ads during the first weekend of August 2020 compared to the first weekend of August 2019. 

Insight #3. There’s No Indication There Were Less Organic Posts Because Of The Boycott 

Methodology: Measuring the volume of new posts 485 Top Advertisers posted on Facebook, Twitter, Instagram, YouTube, and Tumblr during July 2020 compared to July 2019.

Looking at 485 Top Advertisers, they shared 54,540 new posts on social media in July 2020 which was an -11% decrease from the number of posts they shared in July 2019. Broken down by platform, Top Advertiser brands shared -20% less posts on Twitter, -14% less Instagram posts, and -1% less Facebook posts in July 2020 compared to July 2019.  While clearly Top Advertiser brands were sharing less organic posts across the board in July 2020, Facebook was the platform where Top Advertisers were the most hesitant to cut back on the amount of new posts they shared. 

Brands refusing to post ads on Facebook in July meant exactly that and didn’t extend to Top Advertiser brands also scaling back the amount of organic posts they were sharing on Facebook during the month.  At the same time, since 2018 we’ve seen a long term trend of Top Advertisers posting less organic posts on social platforms, which speaks to why the number of new posts on Twitter and Instagram are down year over year. 

Insight #4. The Ban Likely Did Affect Facebook Engagement

Methodology: ListenFirst Social Engagement measures the volume of post responses (likes, reactions, comments, shares, retweets, replies) and fan growth on Facebook, Twitter and Instagram around 485 Top Advertisers brands during July 2020 compared to July 2019.

Overall, ListenFirst social engagement for Top Advertiser brands was up 7%  in July 2020 compared to July 2019, but at closer examination that growth has nothing to do with Facebook. Comparing July in 2020 to July 2019; Top Advertisers saw social engagement increase by 7% on Instagram, while social engagement decreased by -21% on Facebook. 

Since the social engagement signals of post responses and fan growth can both be impacted by paid amplification; Facebook engagement is likely down so significantly for Top Advertiser brands because their Facebook page and posts were much less likely to be amplified in July.  For instance, between January – June 2020 , Top Advertiser brands increased the amount of social engagement around them on Facebook by 12% compared to January – June 2019. Without that paid boost, Facebook engagement decreased. 

Insight #5. Sports, Not Summer (Streaming) Movies, Behind Lift In Instagram Engagement 

That Instagram social engagement around Top Advertiser brands was up 7% during July 2020 compared to July 2019 was a new and positive development during quarantine. For example, between April – June 2020; Top Advertisers saw their Instagram social engagement decreased by -22% compared to April – June 2019.  So what changed in July? As we’ve previously discussed, the return of the sports was a big factor, for instance around the basketball restart, the NBA increased their Instagram engagement by 67% in July 2020 compared to July 2019. Meanwhile in the same time period, ESPN generated 45% more social engagement on Instagram. 

On the other hand, social engagement for streamers wasn’t necessarily up in July, even as people were home more this Summer compared to last. Netflix might have been the Top Advertiser brand with the third most Instagram social engagement in July 2020, but that was still down -6% from the amount of Instagram social engagement Netflix generated in July 2019. The biggest difference appears to be last year Netflix was promoting a new season of Stranger Things, and while The Kissing Booth 2 did come out in July for Netflix and is incredibly popular, it still didn’t provide Netflix with a Stranger Things sized lift on Instagram.   

Want to learn more about how ListenFirst can help brands understand the big picture around social media and activate around those insights? Request A Demo Today!