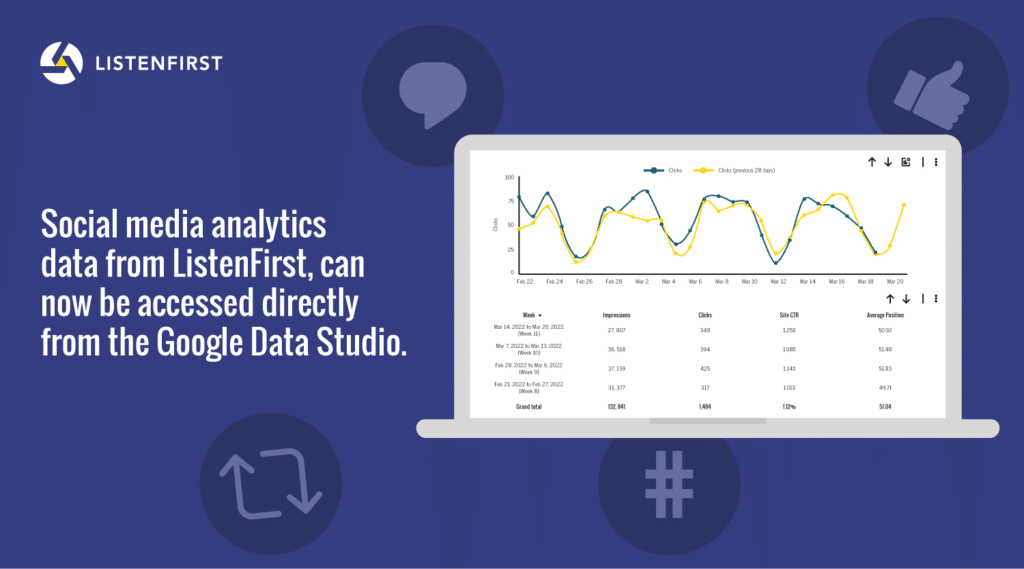
Social media analytics data from ListenFirst, including proprietary metrics can now be accessed directly from the Google Data Studio dashboard.
NEW YORK – March 24, 2022 – ListenFirst, the premier enterprise social analytics solution, today announced the launch of Business Intelligence (BI) Connector for Google Data Studio (GDS), providing their customers with an interface to connect directly to the ListenFirst API and access data on-demand within their Google Data Studio dashboard. This new feature introduces codeless integration and enables ListenFirst customers to create a multitude of data visualizations by manipulating and layering different social media insights within Google Data Studio’s chart/control types and customizations. These visualizations help marketers gain a deeper understanding of their return on investment per project enabling them to make informed decisions about future investments.
Available as a Partner Connector within the Google Data Studio Connectors page, ListenFirst’s BI Connector for Google Data Studio creates a quicker, more seamless way to get bulk selection of data without needing frontend access. Reporting cycles are readily available in GDS by utilizing dynamic date ranges to automatically refresh the latest insights in the desired date range and parameters.
“For ListenFirst customers looking to use data for visual storytelling, we couldn’t be more excited about what the BI Connector for Google Data Studio unlocks,” explains Jonathan Farb, Chief Product Officer. “Not only will users be able to conduct cross data source analysis, ad hoc / on-demand reporting, advanced charting, and data visualization, but Google Data Studio is completely free, meaning everyone with ListenFirst API access can take advantage of it.”
Through the BI Connector for Google Data Studio, social analytics insights from ListenFirst can also be published side by side with critical business data points from other sources in GDS, turning complex, data driven intelligence into easy to understand visualizations.